In May 2014 development of Barnplay.se was winding down but two of my colleagues, Simon and Emil, was haunted by a feature they did not feel was implemented optimally.
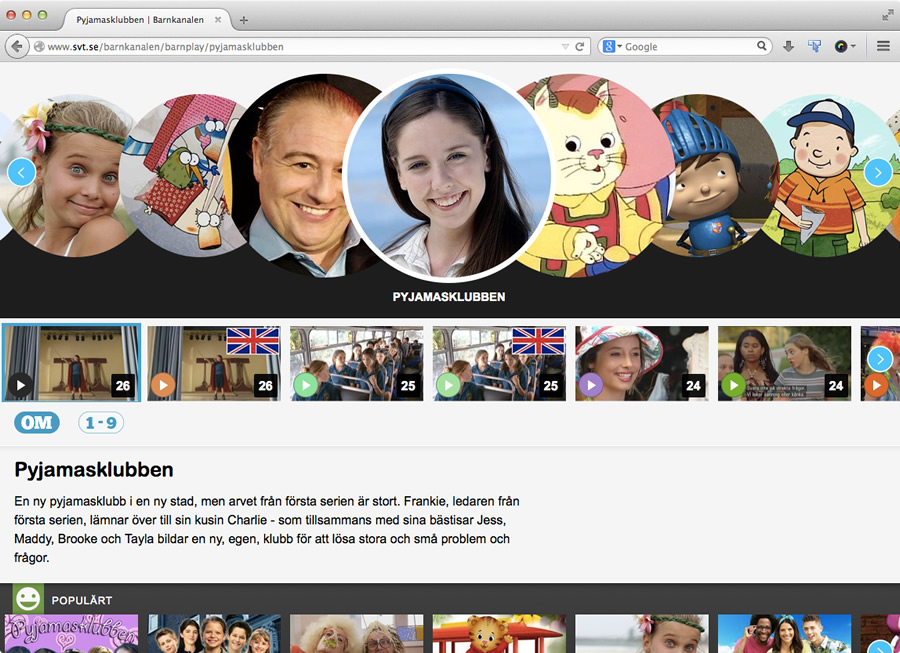
All shows in Barnplay have episodes that kids can choose from. However, the shows also have a text about the show and some shows have other “functions”:
- sort the episodes differently
- a link to the shows web site on barnkanalen.se
- mark the show as a favorite or remove from favorites (only in our apps)
These “functions” where presented with a round icon and text and Simon and Emil thought this could become better. A smaller representation for the functions would also make the functions fit better in phones held in portrait position. Their suggestion was a “button” look without a text label.
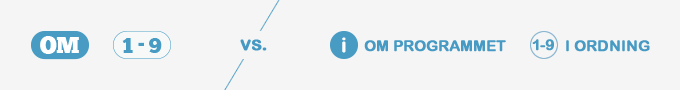
I however had already via usability tests proved that icon+text works. So I did not want to change to a “button” look without first proving that it was better. I decided to do an A/B test in our tool Optimizely.
While Emil created graphics for the “buttons” and Simon made them possible to display in Barnplay I set up the experiment in Optimizely. The variations in the experiment where “icon+text” versus “button”. We want the functions to be used in general but ultimately want them to generate video starts. For goals I therefore choose to track:
- taps on any of the functions
- taps on each of the functions
- a two step activity where the visitor has first clicked “Sort” and then started an episode
We ran the experiment for 2 days which resulted in 142 000 visits and lots of taps.
All shows have the “Read about the show” function which is why that function has so many more taps then other functions. The stunning difference between the text+icon and button variants is a strong indicator that button works better. Link taps where quite few so the result is not so interesting. That the visitors used the favorite function less is troubling. The sorting and sort+start goals however look very promising.
Despite the decrease in activity on the favorite function, buttons was chosen as the winning variant in this test. Simon implemented them fully and they are now in production.
So, I had to change my mind and I love when that happens! :)